A few weeks ago, Axsium Group announced the release of Planara, our new integrated labor planning and analytics solution. You’ve likely already heard about Planara’s ability to analyze complex planning assumptions, compare multiple what-if scenarios, and provide labor performance dashboards, among other features.
As a lifelong WFM and labor planning geek, I find these capabilities incredibly exciting! So as a preview to our upcoming webinar, I wanted to share three of my favorite features.
1) Templates: Enhancing Labor Planning Agility
Planara has numerous innovative features that will change your labor planning and analytics processes for the better. Let’s start with what is, for me, one of the biggest game-changers: Templates.
We all know labor budgeting involves a host of different inputs. Of course, you have labor models, average hourly rates and min/max coverage rules to consider. But your budget is also reliant on how you relate these various inputs and metrics to calculate labor hours and costs.
Traditionally, the calculation logic is reasonably hard coded into the spreadsheet, homegrown application, or WFM system you’re using for labor budgeting. When that’s the case, trying to make a change in these calculations can be like trying to get an oil tanker to change direction.
But Planara has templates. And that simple difference makes it more like a hovercraft.
With Planara, you can now configure templates to contain any presets you want. And you can switch between these templates as much as you want. For example, let’s say you need to evaluate two different sets of effective-dated configurations for the coming year. Now you can do it easily in the context of full year, chainwide planning scenarios.
Example: Jumping Between Scenarios

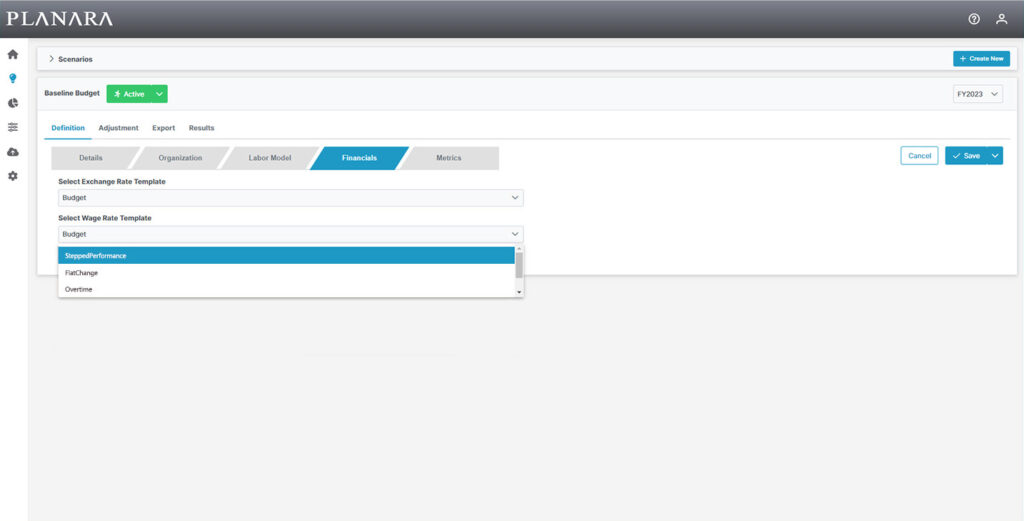
Let’s say I’m evaluating three different proposed pay structures a client is considering. You can use Planara wage rate templates to compare the labor impact of each of these average hourly rate changes, whether managed at the location, department, or job level.
Planara’s templates aren’t limited to just wage rates, of course. There are a host of other components you can manage via templates. These include min/max rules, fiscal calendars, and exchange rates. But in this case, I’m interested in those new wage rates.
The first proposal is a new stepped performance wage rate scheme for our on-the-floor workers. I can run a scenario in Planara that goes through all the calculations. And that can be for one location or all our locations, or any subset of my choice. In this example, the scenario results show me how the increase will affect our most and least productive warehouses.
Planara lets me know the extra cost and/or benefit of the change for each of these locations. I can also see the impact that will have on their ability to deliver on their expense targets. I can even adjust the wage rates within a scenario. That lets me see the impact of the change with next year’s minimum wage increase applied.
Because I’ve saved the scenario I can revisit it later, but first I’ll be able to have a look at the same scenario using the other two proposed increases.
Of course, I’ll still have to spend time thinking about the impact of these new numbers. But Planara cuts that time to calculate the numbers down significantly. And even better—I can compare the metric results for the three scenarios side-by-side to get a real sense of where the benefits and risks are.
2) Flex Rules: Improving Labor Planning Accuracy
I’ve written previously about differences between raw hour needs and business rules. Now, thanks to Planara, all that becomes much, much easier.
A traditional labor model solution focuses on the raw hours your locations need based on activity-based workload demand. Say, for instance, you’re a large US retailer with locations in several states. One of your locations needs 200 hours a week to run. But the company has a rule that says that no location should be below 250.
According to the raw hours, that means you’ve got 50 hours to spare. Most labor models—whether managed in Opus, Excel, or other systems—struggle to deal with that extra pot of hours. It usually ends up being stored as a lump sum somewhere in the application.
This is where your WFM solution comes in. It’s working with the same criteria, but that means it can diverge from your budget. It comes up with the same 200 hours that your Excel budget did, but it’s automatically aware of that pesky 250-hour business rule.
What your WFM does next is very interesting. It knows you need 50 extra hours, but rather than store it in a lump sum somewhere, it spreads it out everywhere. In the past, labor models and budgeting applications haven’t been able to recreate this automation, whether by activity or by day of week.
With Planara, that changes. Actually, Planara’s Flex Rules feature doesn’t just solve the problem but turns it into a significant benefit. You can set a Flex Rule to do whatever you want with those extra hours. And you can have any number of Flex Rule templates and change them whenever you want.
Example: Getting into the Details
Let’s stick with that US retailer with an extra 50 hours. Using Planara, I can spread the hours across specific tasks or job-related work. Usefully for this location, I can also have Planara allocate the extra hours to specific positions.
Historically, the location we’re focusing on has needed more sales reps than they’ve had budgeted. Knowing this, I allocate the full 50 hours to the sales team. The sales rep shortfall usually occurs during the location’s peak days—Friday, Saturday, and Sunday. Planara lets me allocate all 50 hours across those three days.
Using Planara’s Flex Rules, I can now see where my locations, and so the wider organization, will get the most benefit from those extra hours. In the past, they’d end up as a lump sum in my budget which my WFM solution would automatically spread across tasks, roles, and days. That doesn’t allow for much analysis.
And, even better, I can now cost those extra hours properly. I’ve allocated them to the sales team, so they’ll get costed to sales. That will make reporting down the line a lot more accurate.
3) Scenario Dashboard: Fostering Labor Planning Alignment

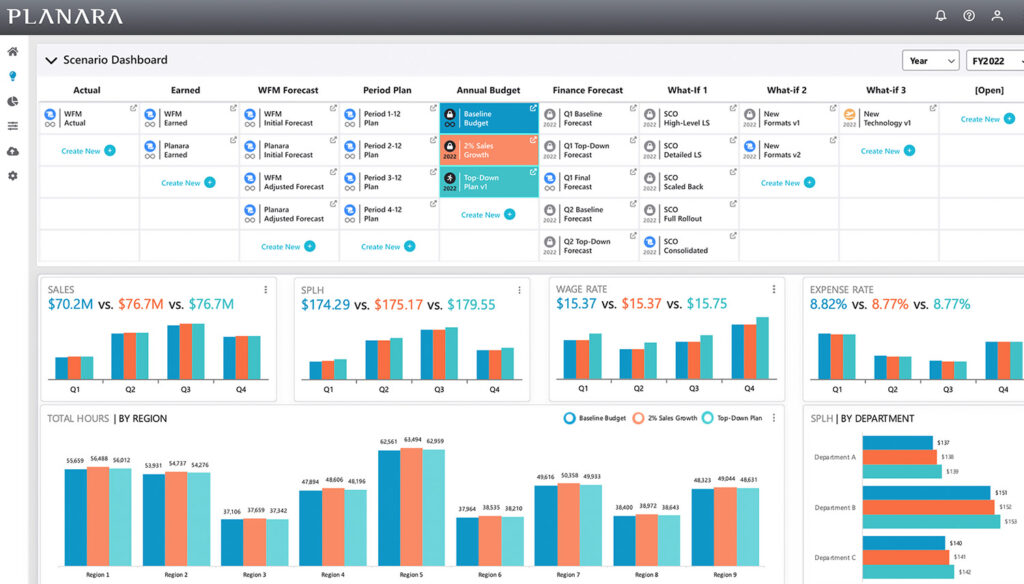
The final Planara feature I want to touch on briefly is the scenario dashboard. An intuitive and easy-to-use dashboard is table stakes for any good software these days. But Planara’s scenario dashboard isn’t just intuitive and easy-to-use. It also solves a persistent labor planning issue.
Planara’s dashboard gives you quick and easy access to everything you need during the labor planning process. That’s probably in line with your expectations for any labor planning solution worth its salt. But Planara is cloud-based, so it gives everyone using it access to everything they need.
In the past, different budgets would be in different spreadsheets. Budgets by different teams would often be in different folders. But Planara’s dashboard clearly lays out the various scenarios—and you can categorize them. That means everyone from the teams involved in the planning process can see each other’s work and compare the iterations, right there in the dashboard.
Example: Bringing Teams Together
To dig into the dashboard, let’s use the example of a healthcare provider on the US West Coast moving into the latter stages of the labor planning process. The Finance and Operations teams have pulled together their initial budgets.
Naturally, I’m working on the Operations team. Traditionally, we would have run the baseline scenario to show how much labor we need. Then the two teams would go into a familiar pattern of negotiating to reach a final labor budget that both sides are happy with.
Now, thanks to Planara, I can compare Finance’s most current budget to my own and easily see where we have differences in core assumptions or opinions. I’m also able to compare the entirety of the two budgets quickly and easily. This means I can get a full sense of why Finance have allocated time in the way they have.
In most companies, it’s like Finance and Operations are speaking two different languages. And the labor planning and budgeting process has always had a problem with translation. Operations wants more hours to do the job properly. Finance wants to spend less money, and the way to do that is often to budget fewer hours.
But now with Planara’s dashboard and other scenario comparison reporting features, the two teams can see each other’s work. That’s a great first step on the path to building bridges. Soon, everyone can start speaking the same language, meaning less confusion. And less confusion inevitably leads to better collaboration.
And that’s why I’m so enthusiastic about Planara’s home page dashboard. It’s a helping hand to bring your Finance and Operations teams together and come to the right result.
What Next?
If you couldn’t tell, I’m really excited about Planara. And I’m proud to have leant my subject matter expertise to help Axsium develop it. And the groundbreaking features don’t stop at what I’ve described here. Don’t forget to register for our upcoming webinar on July 14 to experience a deep dive into far more of what Planara can do.
