In last month’s blog, we discussed the longstanding challenge of aligning “top-down” budgets and “bottom-up” forecasts across your organization, and laid out four steps to bring balance back to your workforce planning process:
- Align “top-down” and “bottom-up” methodology and planning assumptions
- Adapt store level metrics and incentives to meet your overall business goals
- Adopt a continuous forecast regimen that informs and maintains the budget
- Advance your capabilities and collaboration with a more end-to-end toolset
This month, we will expand on this topic by addressing the gap that almost always exists between what the stores need versus what leaders in the organization want to achieve in the coming year.
Part 2: Adapting Store-level Metrics and Incentives to Meet your Overall Business Goals
When we talk about store-level budgets, we ought to be more specific about what’s being budgeted. Some retailers budget by dollars (or local currency), while others focus on hours. Some utilize a rate of sales (i.e. payroll/sales), while others utilize a rate of productivity (i.e. sales/hours). And some fix budgets for the year and others by quarter or period, while others have moved on to a rolling “earned hours” methodology. Ultimately, how you budget and what metrics you employ depends on the unique culture of your company and the relative evolution of your labor management capabilities. We at Axsium recommend that retailers utilize performance metrics that are both flexible enough to effectively respond to current trends while fair enough to drive sustainable and justifiable results.
In most cases, we observe retailers getting creative in achieving overall company budgets once set, but not always so precise in managing those budgets at the individual store level. Often, allocating budgets to the stores is heavily reliant on what was spent or budgeted the prior year, a process that seems fair, but in fact can institutionalize unfairness when repeated over time. What’s needed is a proper baseline to measure results against and assess opportunities to improve in the coming year – and that’s where your “bottom-up” labor model comes into play. To illustrate the value of a store-specific labor model in allocating budgets – and since we’re in October – let’s talk some baseball.
Many of us have dreamed of batting in the bottom of the ninth when your team is down. The typical outcome of these dreams is hitting the big home run, but the reality is that most of us non-major leaguers would be more likely to score on a blooper or error than hitting a ball out of the park. In the end, does it matter how we win, so long as we get the result?
Perhaps in the World Series, a game-winning hit doesn’t need to be pretty (just ask Mookie Wilson). But in retail “winning” (or hitting financial targets) without the means to consistently back it up can be costly – especially for stores. For example, let’s say that the upcoming year will involve some purse-tightening and Finance just put two more basis points of expense rate improvement on the board. Sure, Ops would like to hit it out of the park and come up with the perfect plan to achieve this, but when it’s the bottom of the ninth and budgets are due, they often end up settling for less.
What we most often see is a proportional “haircut” across all stores, or at least mature stores. In the below example, let’s assume that Stores B and D are the same format, possess the same general characteristics, and run at the similar sales volumes – but Store D operates at a higher relative productivity rate. Under the haircut scenario, none of this will matter. Store D will face the same percent change in budget over the prior year as Store B.
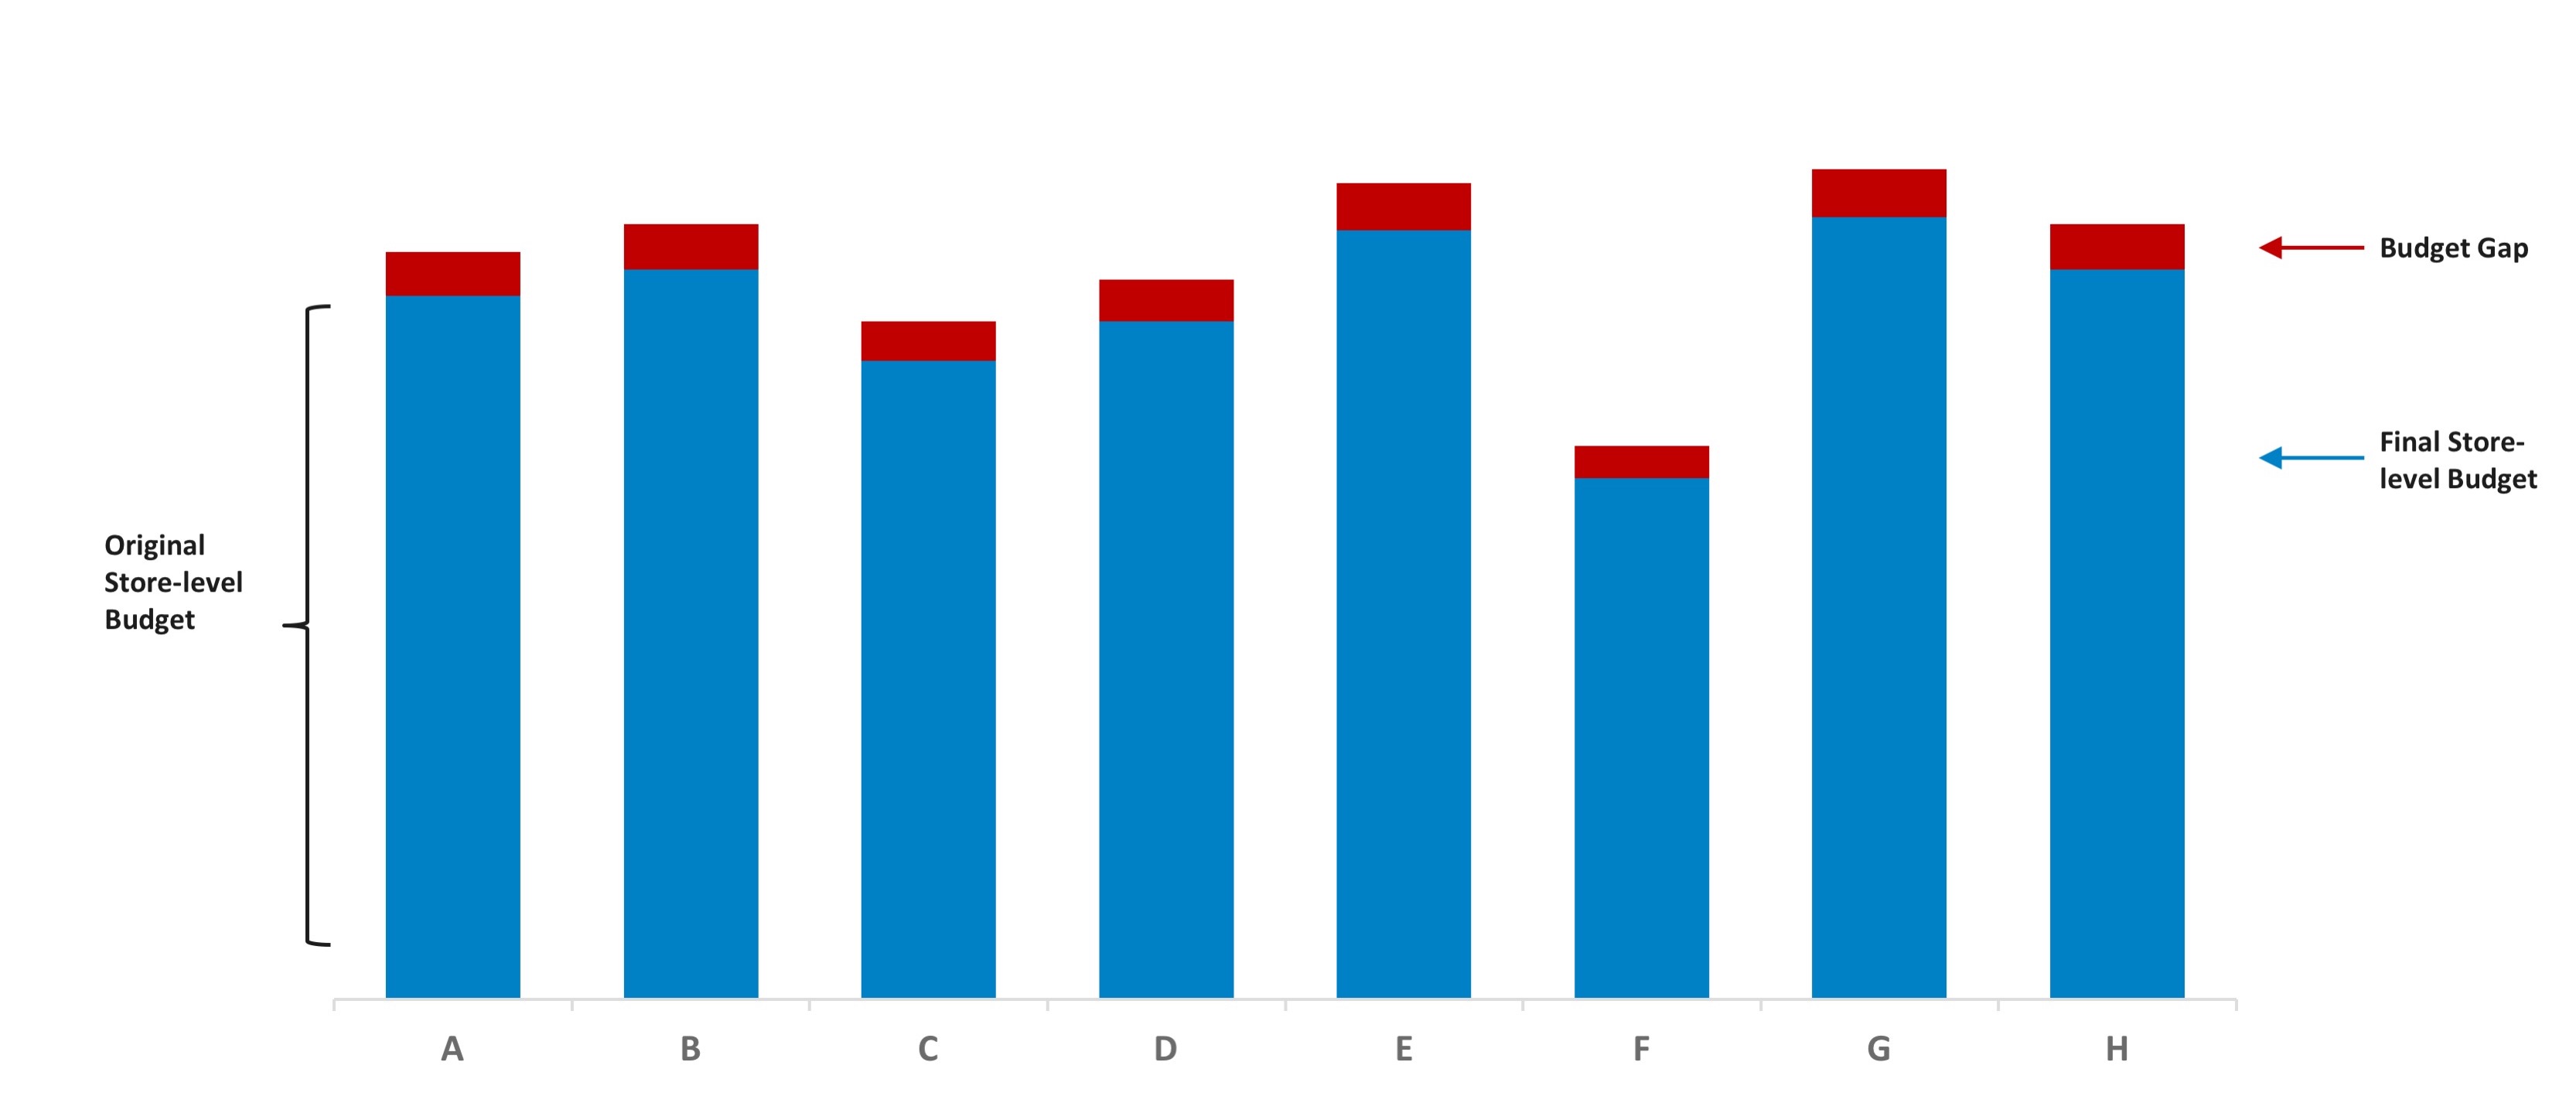
At face value, this may seem like a fair approach, and the difference between Stores B and D may not be all that significant in a given year. But if the haircut trend continues, the gap will only grow over time, thus different productivity expectations will only further solidify around what should be similarly treated stores. Therefore, the overreliance on LY actual spend combined with treating every store the same in addressing the budget gap will lead to institutionalizing unfairness in the process.
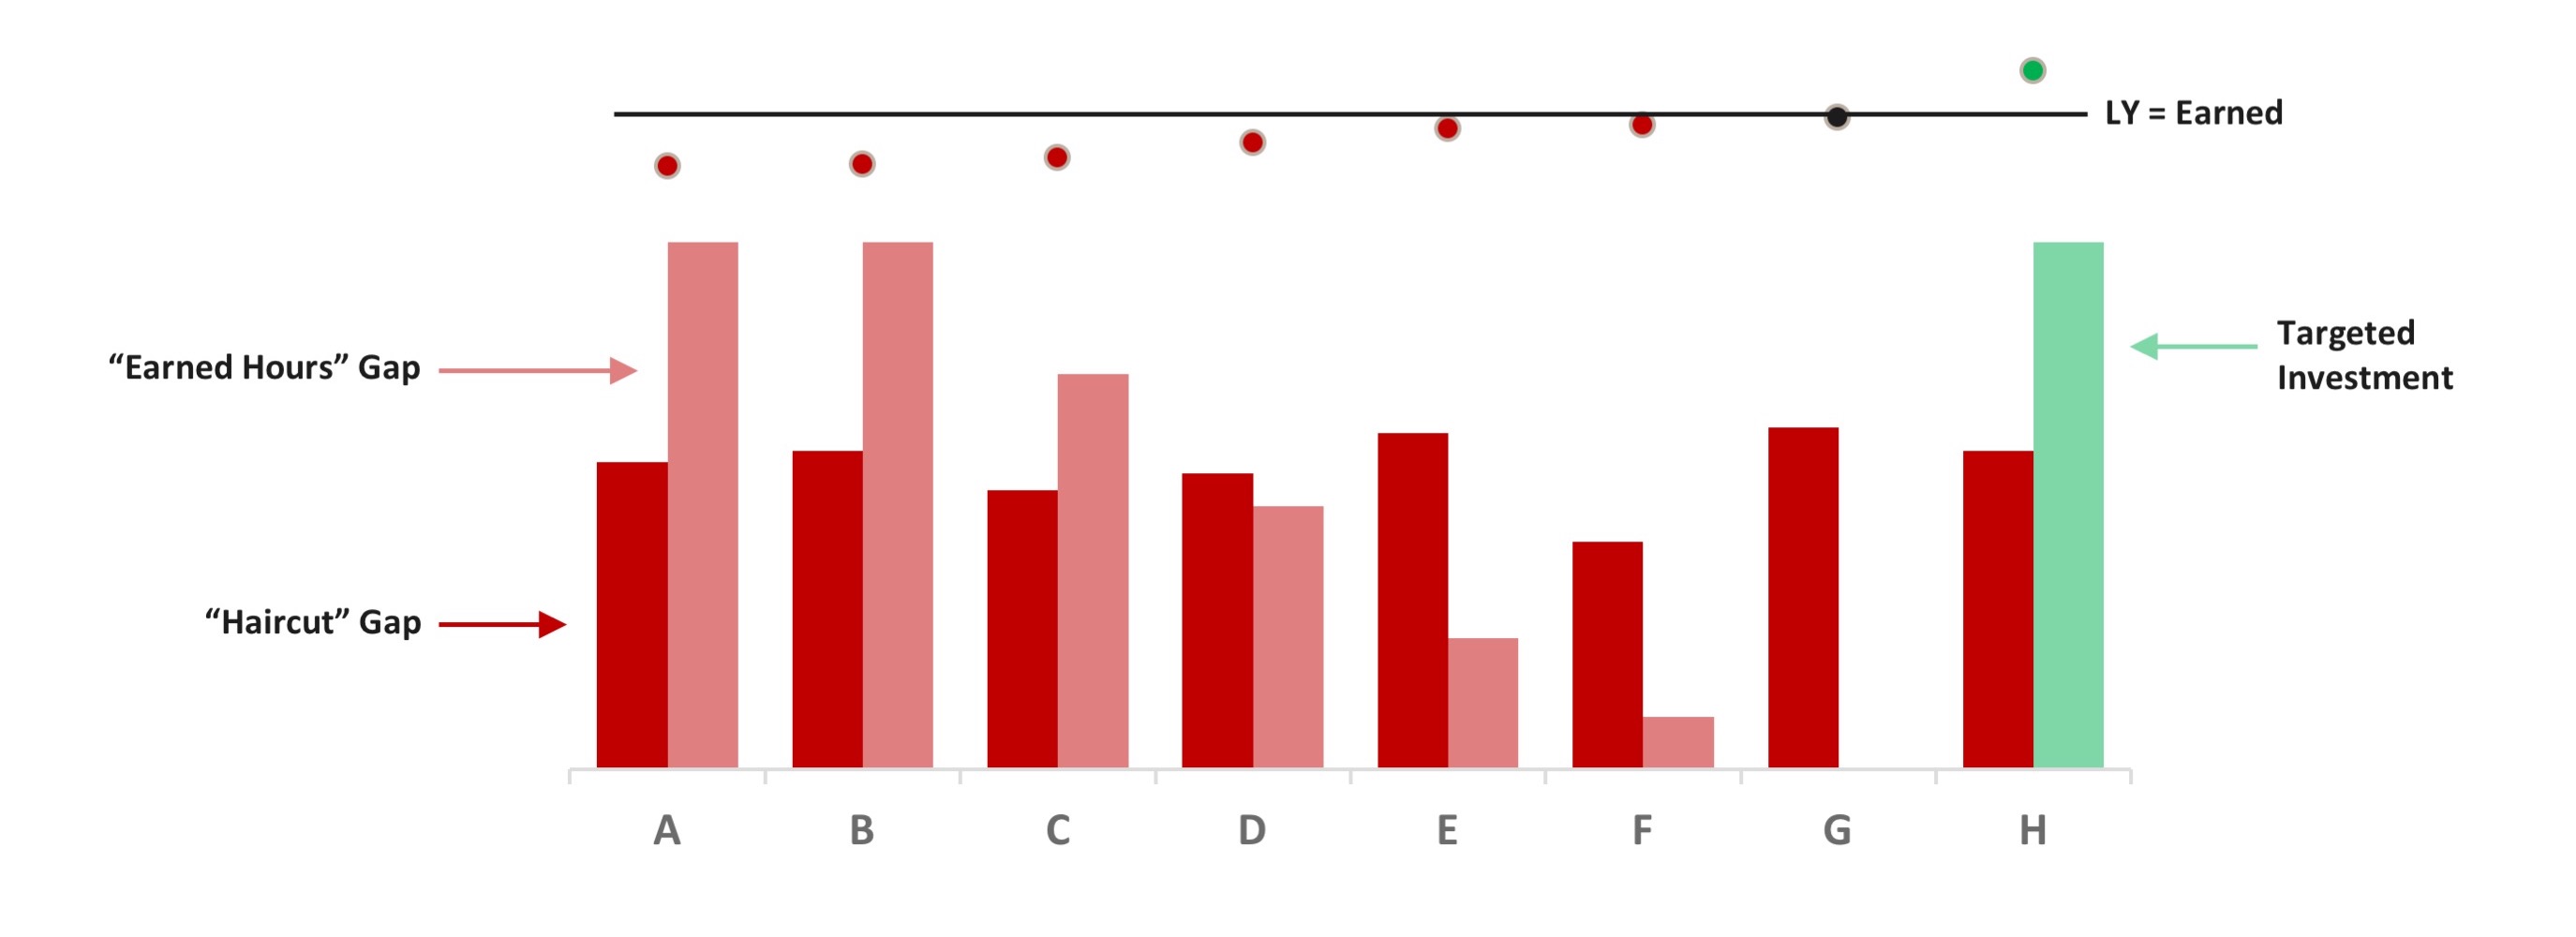
To address the fairness issue, and in turn add more explanatory power to the productivity gap each store is asked to achieve, we recommend utilizing the “earned hours” metric. When comparing prior year actual results to what each store would have earned with the labor model (applied to actual volumes), you can more easily gauge each store’s relative productivity performance against a common standard.
In the proposed example below, the line represents zero variance between what the store spent versus what they would have “earned” with the labor model with perfect forecast accuracy. Stores below the line overspent compared to this retroactive standard, whereas stores at or above the line were able to adapt to and achieve their operational targets. Now, consider distributing the gap for next year using these variances to earned hours as a baseline.

Using this approach, the lower performing stores on the left take on more of the burden in achieving the budget gap. And you now have an opportunity to justify pushing Store B a bit more compared to the relatively better-performing Store D. Keep in mind that this example is somewhat extreme so as to more easily visualize the variances, but the general idea is the same: if the goal is to get each store at or below their labor model hours, then this approach will provide a significant leg up on the simple haircut method.
On the flip side, you can also use the “earned hours” approach to strategically target stores for additional investment. Stores E and H could be very similar in most areas, but perhaps Store H accumulated years of difficult productivity haircuts, which ultimately was taking a toll on their ability to operate effectively or service customers. This is exposed now that the labor model has been incorporated into the budgeting process, and so additional budget could be provided to help even out the playing field and drive sales.
Ultimately, whether it be investment decisions like this or soliciting edits from field leaders, there is always an “artistic” element in budgeting. But by using this method to allocate the overall budget down to the store level will create a more “scientific” starting point. Managing the budgetary gap in this way will offer all stores a more reasonable chance of improving their performance, hitting their metrics, and fulfilling the overall goals of the business every year.
Stay Tuned
Coming up in our third post in this series, we’ll look at how adopting a continuous forecast process can help better inform and maintain your store and corporate-level plans throughout the year. If you have any questions about this this post or the services we provide, please reach out to Al Asgarian at aasgarian@axsiumgroup.com or Luke Muellerleile at lmuellerleile@axsiumgroup.com.